Mapping Buried Ventilation Pipes with GRAD
Overview/Intro
A former factory site facility had been demolished several years earlier, and little documentation was available. Missing as-built drawings and incomplete historical records created significant uncertainty about buried infrastructure across the site. The approximately 6,000 m² site lacked as-built drawings and reliable documentation, creating significant uncertainty regarding subsurface conditions.
The objective was to locate and map a network of clay ventilation pipes believed to be buried between 0.5 and 1.0 meters below ground surface, with estimated diameters ranging from 0.2 to 0.6 meters.
The Challenge
The site contained construction debris both on and beneath the surface, generating numerous reflections that obscured potential utility responses. In addition, portions of the ventilation system were suspected to be partially or completely collapsed, making them even harder to distinguish from surrounding materials.
The ventilation pipes were constructed from clay rather than metal, reducing the strength of radar reflections typically associated with buried utilities. Conductive soil conditions further complicated the investigation by limiting signal penetration and reducing overall data quality.
Initial test profiles revealed a highly reflective subsurface environment with numerous anomalies and overlapping responses. Identifying meaningful patterns within such a dataset required more than conventional profile interpretation, it required advanced processing and visualization tools capable of revealing subtle linear features across a large survey area.
Scope of Work
Service Provided: Ventilation pipe mapping with GRAD
Survey Area: Approximately 6,000 m²
Depth Requirement: Clearance to a minimum of 4″ to safely accommodate 2″ anchors.
Technology Used: Ground Penetrating Radar (GPR), GNSS positioning, GRAD Technology
Our Solution
Survey Design and Data Acquisition
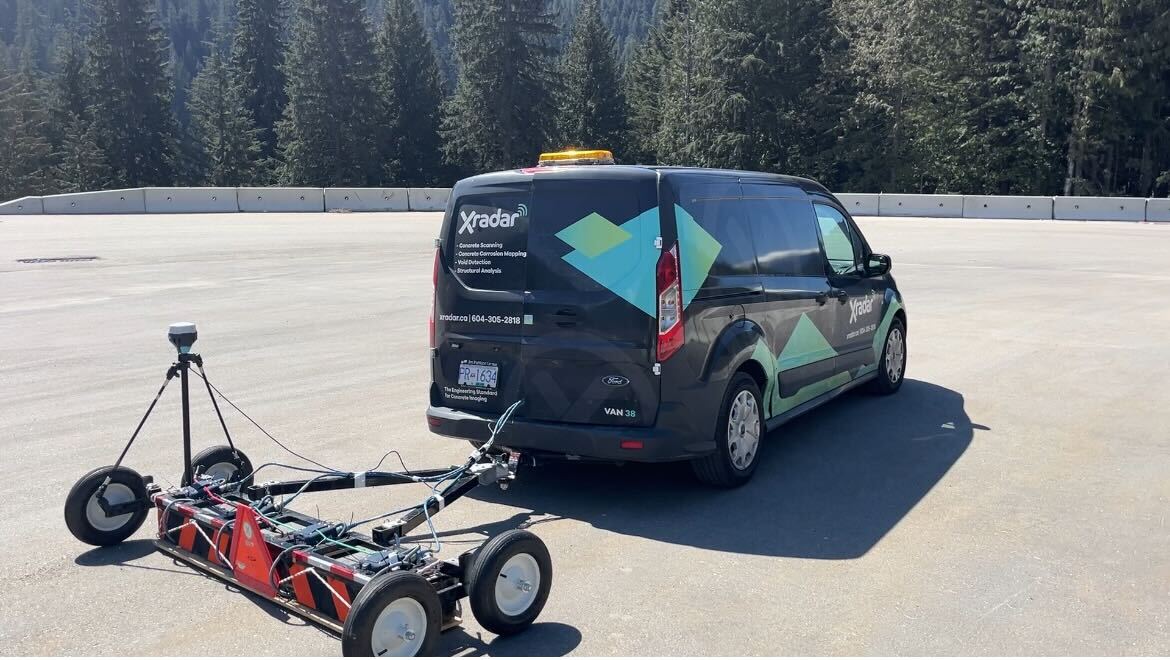
Uneven terrain and surface debris limited the use of larger or more sensitive survey systems. To overcome these constraints, a rugged single-channel GPR antenna capable of being dragged across rough ground was selected. The system was paired with a GNSS receiver mounted close to the antenna to reduce positioning errors caused by antenna movement over uneven surfaces.
Initial test profiles revealed a highly reflective and complex subsurface environment. As a result, the survey strategy focused on collecting large-area GPR grids with approximately one-meter line spacing across the site.
The rationale behind this approach was straightforward: even if individual sections of the ventilation pipes could not be clearly identified within noisy radar profiles, linear subsurface features would likely produce detectable patterns when viewed within a larger, properly processed 3D dataset.
Processing and Visualization in GRAD
Once data acquisition was completed, the project moved into GRAD for processing, visualization, and interpretation.

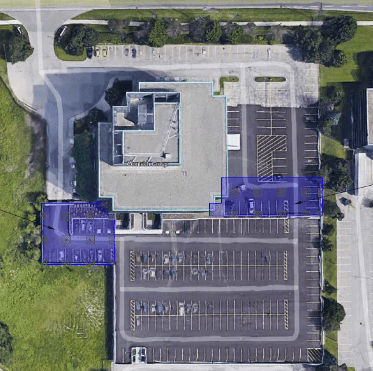
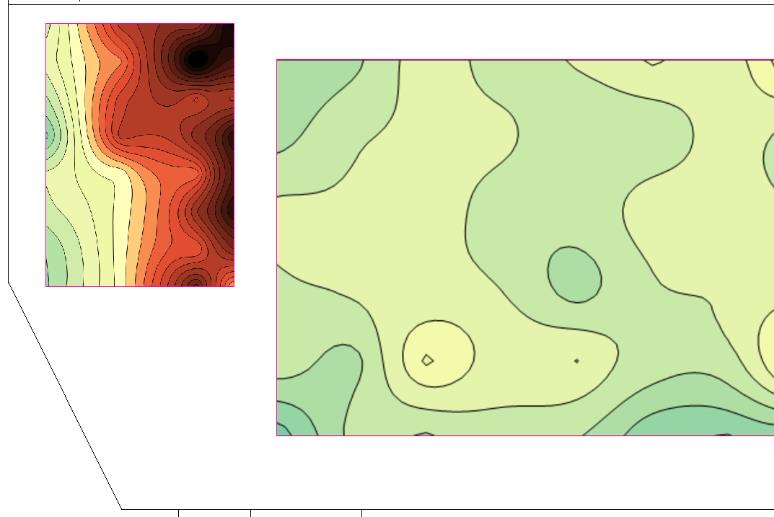
Figure 1. A depth slice capture using second derivative depth analysis with sample size 50, starting at depth of 0.35 m BGS.

Figure 2. Interpretation of the dataset from Figure 1. Building outline on the left of the image was mostly visible at 0.15 m BGS
Methodology
Position Correction and Data Preparation
The first step involved importing the datasets into GRAD and refining positional accuracy using the GPS Edit module.
GNSS-based surveys often contain positioning uncertainties, particularly in difficult site conditions. While post-processing cannot completely eliminate positional errors, GRAD’s GPS Edit tools enabled the survey team to correct and improve trajectory accuracy using known reference survey points.
After position verification, time-zero correction was applied to ensure proper depth calibration throughout the dataset.
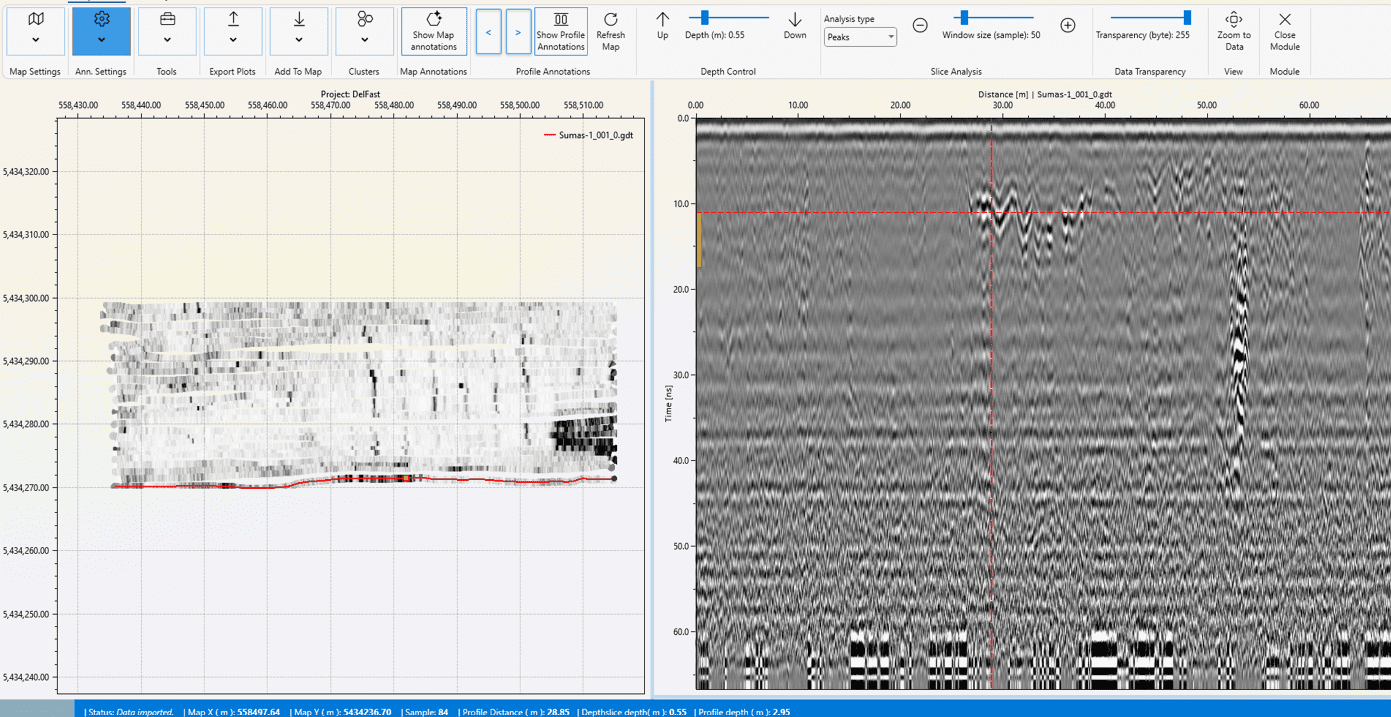
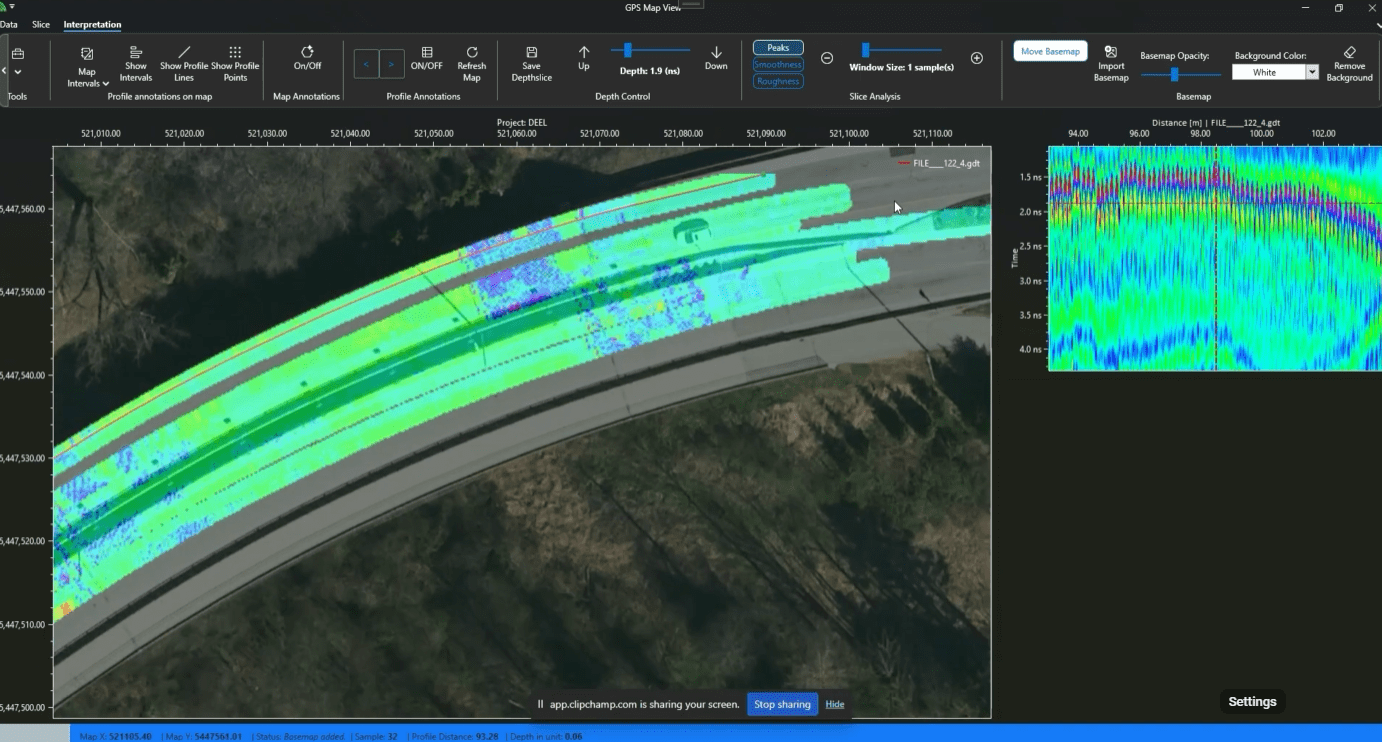
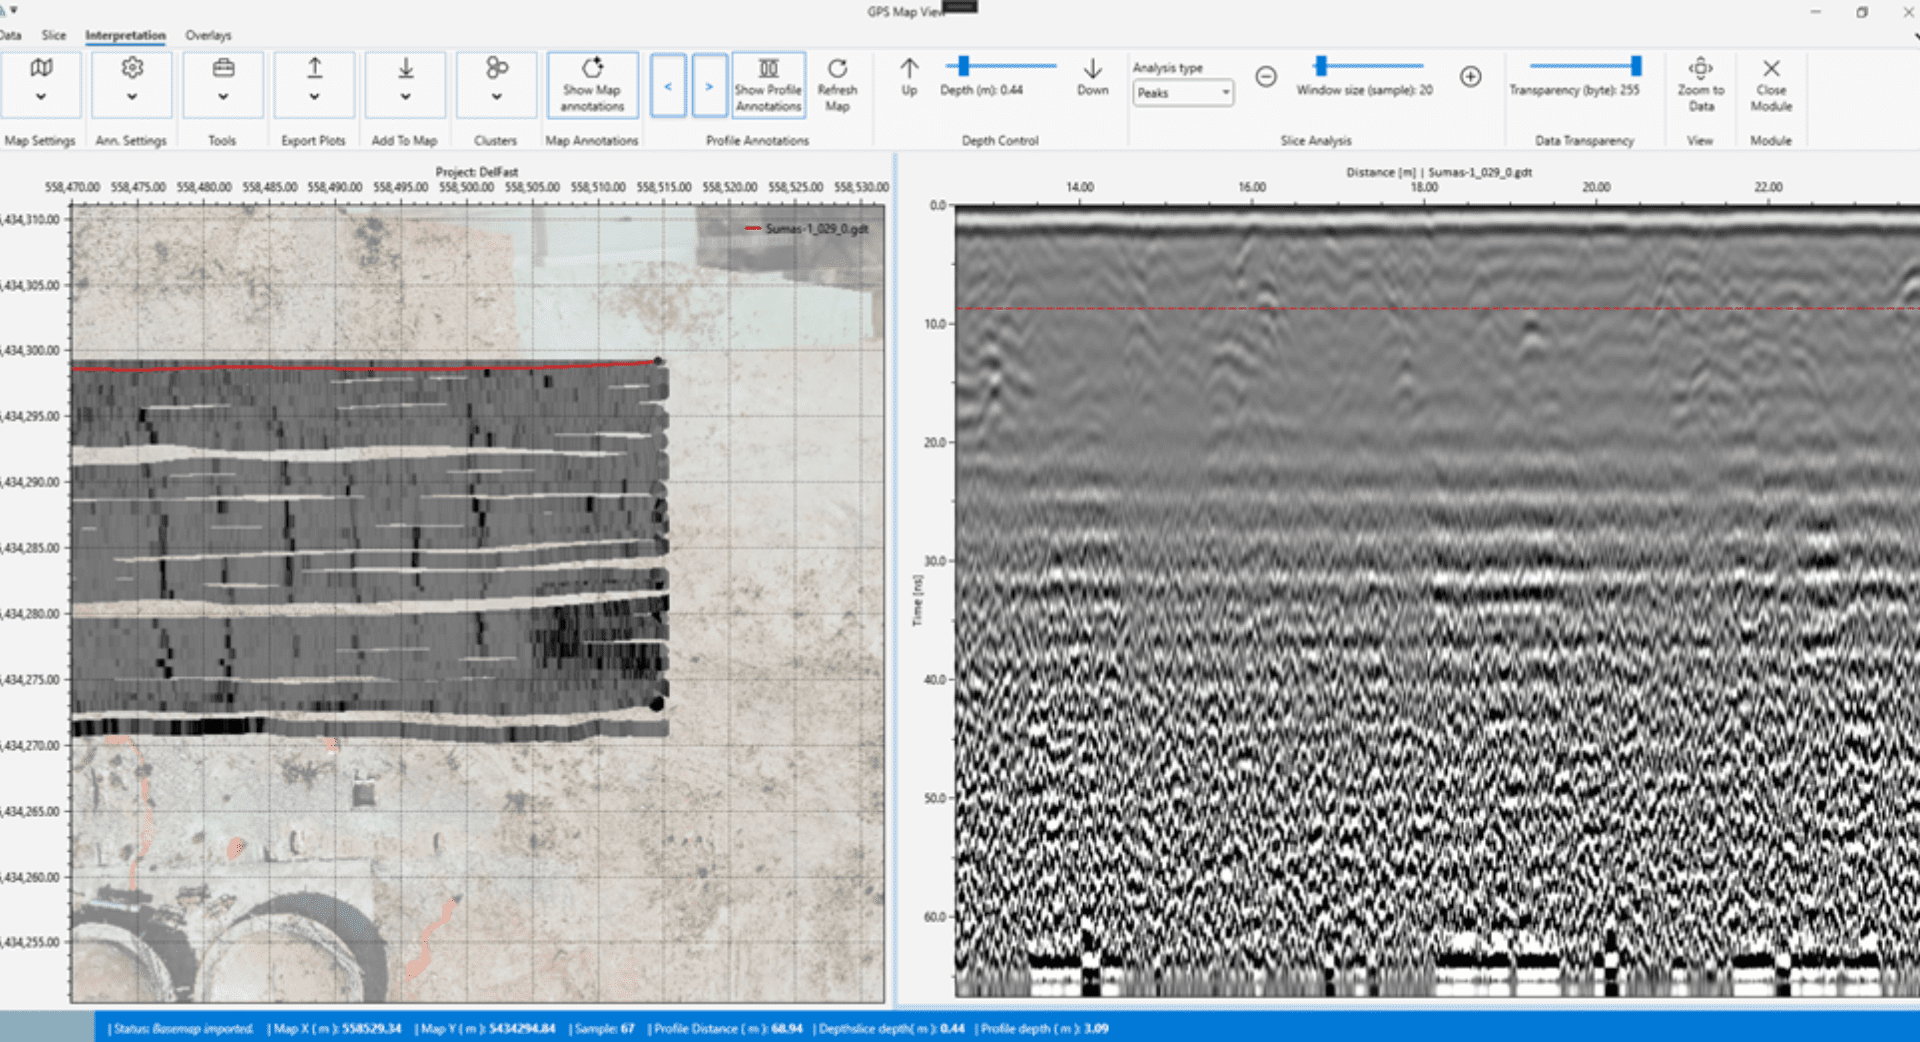
Figure 3. GPS Map Module. Depth slice is on the left, profile on the right. Red line on the map indicates the location of the associated GPR profile shown on the right.
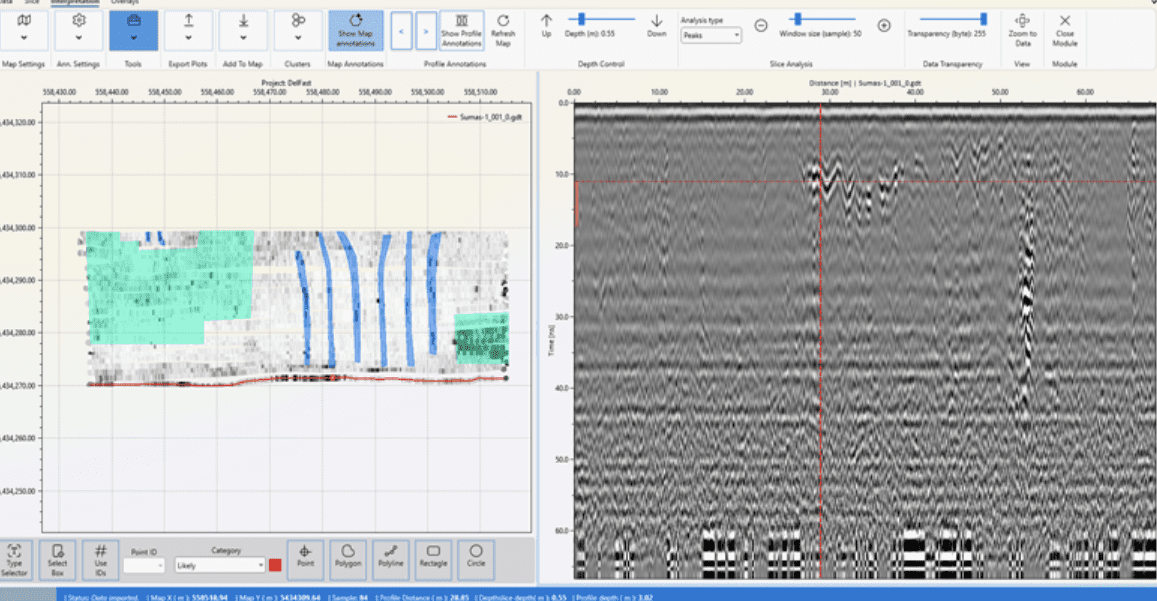
Figure 4. GPS Map Module with map interpretation turned on.
GPR Processing Workflow
Each profile underwent a standard processing workflow that included:
- Manual gain recovery
- Frequency bandpass filtering
- Noise reduction and signal enhancement
- Compilation into a unified 3D dataset
To further improve interpretability, advanced processing techniques were applied, including GPR trace power equalization. This step enhanced consistency across the survey area and improved the visibility of subtle subsurface features that might otherwise remain hidden within complex reflections.
Results/ Conclusion
Conclusion
This project highlights the value of combining thoughtful survey design with advanced GPR processing and interpretation tools. While the site presented numerous obstacles, including uncertain utility locations, difficult ground conditions, and noisy radar data, GRAD provided the workflow necessary to transform large volumes of GPR data into clear, interpretable results.
Through accurate positioning, advanced signal processing, powerful slice analysis, and synchronized profile-to-map visualization, GRAD enabled the successful identification of buried ventilation infrastructure and areas of potential collapse, helping guide subsequent site investigation activities with confidence and precision.
See What GRAD Can Do
GRAD combines advanced processing, visualization, and interpretation tools to help extract more value from GPR data.
Explore GRAD’s capabilities